A plate cam, also called a peripheral cam, is an element that, when a plate (cam) with a certain contour curve is rotated, causes an element called a follower (in technical terms, a driven surface that is in contact with the cam) that is in contact with that contour to move in a reciprocating or oscillating motion intended by the designer. A follower is an element that gives the reciprocating or oscillating motion intended by the designer to an element called a follower (in technical terms, a driven surface that is a counterpart of a cam).
When designing and manufacturing a gear or cam mechanism by oneself, it is necessary to draw a contour curve of the cam based on a cam diagram in order to give a complicated behavior that changes the intended angular velocity. This article starts with an explanation of cam diagrams, describes how to obtain the velocity ratio, and then summarizes how to design the contour curve of a cam.
Cam Chart
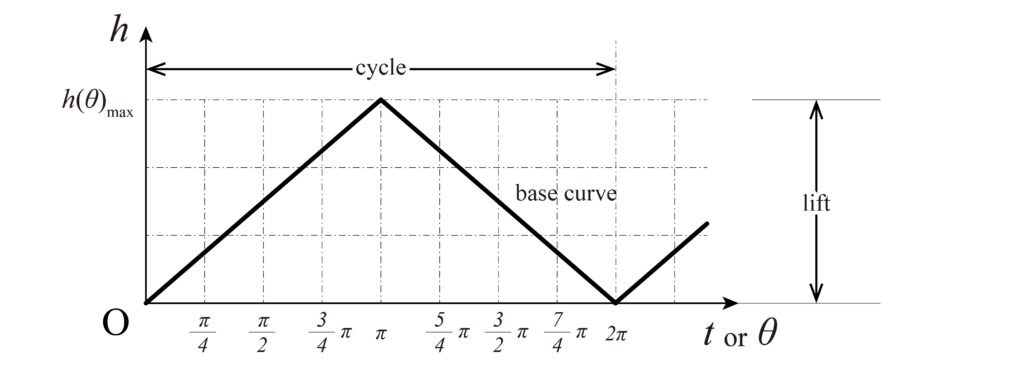
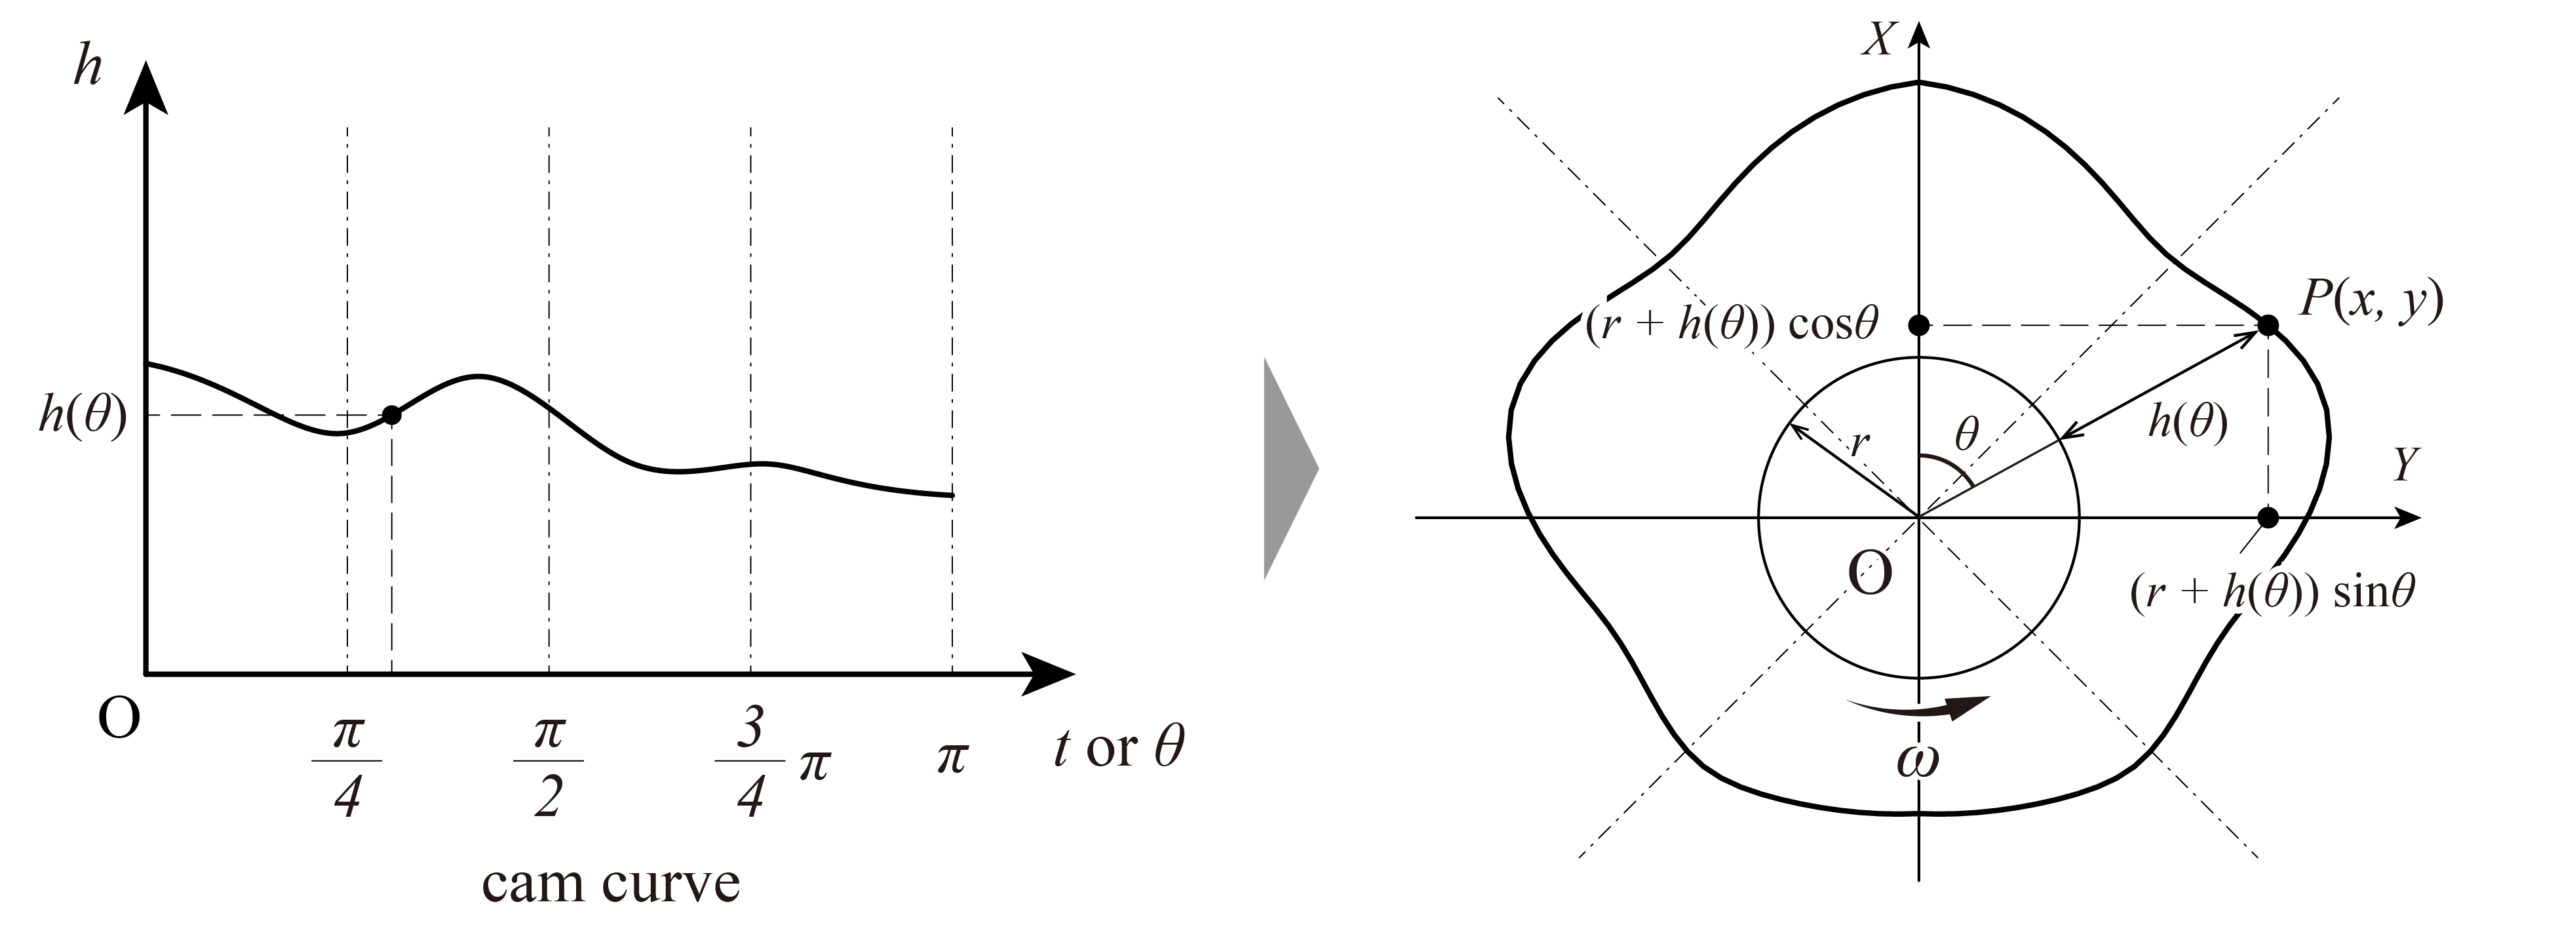
A cam chart (cam diagram) shows the relationship between a cam’s rotation angle and the amount of follower displacement. As shown in the figure above (Fig. 1), the horizontal axis represents the time or angular displacement of the cam, and the vertical axis represents the displacement of the follower. The line in the figure is called the base curve, and the maximum displacement (h) is called the lift.
The contour line of the plate cam that gives motion to the follower is obtained by wrapping the base curve of the cam diagram around a circle of a certain radius (r), the reference with the rotation axis at its center, called the base circle.
speed ratio
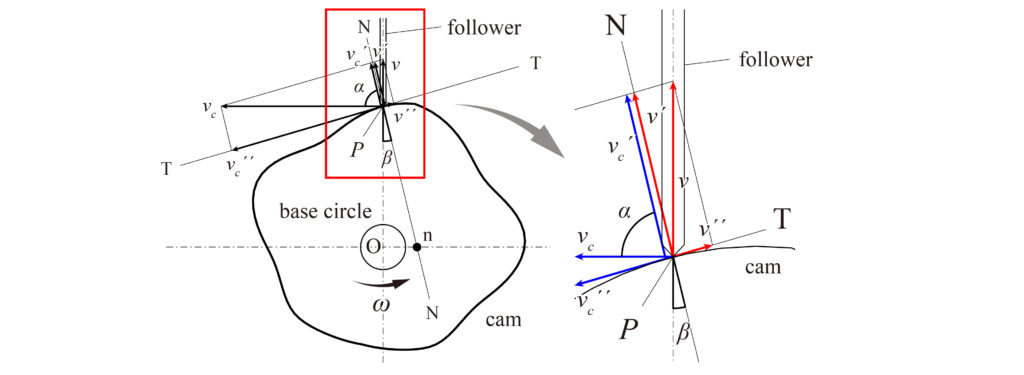
Before obtaining the cam contour from the cam diagram, it is necessary to sort out how to obtain the velocity ratio. Here, we will derive it using an example where the position of the cam is fixed and only the follower is in linear motion.
Let the angular velocity of the cam be \(\omega\), the velocity of the follower be \(v\), and the contact point be \(P\). Draw the common tangent line \(TT\) and the common normal line \(NN\) at the point \(P\), and let the velocity \(v_c\) when the point \(P\) is a point on the cam and the velocity \(v\) when the point \(P\) is a point on the follower be the speed of the normal direction components, respectively \(v_c^{\prime}\) and \(v^{\prime}\), and \(v_c^{\prime\prime}\) and \(v^{\prime\prime}\) for the tangential direction component.
The condition \(v_c^\prime = v^\prime\) holds when the cam and follower always remain exactly tangent. Therefore, if the angles \(v_c\) and \(v\) form with the common normal are \(\alpha\) and \(\beta\),
$$ v_c^\prime = v_c\cos\alpha=\omega\cdot \overline{OP}\cdot\cos\alpha $$
Since $$ v^\prime =v\cos\beta=v\cos(\frac{\pi}{2}-\alpha)=v\sin\alpha$$
Since,
$$ \omega\cdot \overline{OP}\cdot \cos\alpha = v\cdot\sin\alpha $$
Hence,
$$ \frac{v}{\omega}=\overline{OP}\cdot\frac{\cos\alpha}{\sin\alpha}=\overline{OP}\cdot\cot\alpha $$
If the intersection of the line drawn perpendicular to the direction of travel of the follower from \(O\) and \(NN\) is \(n\), then is expressed as
$$ \frac{v}{\omega}=\overline{OP}\cot\alpha=\overline{On}$$
Or
$$ v=\omega\cdot\overline{On} $$
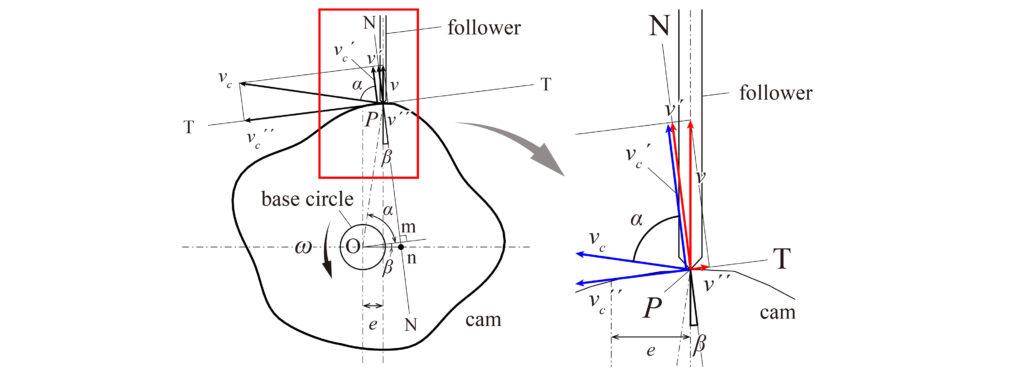
If the follower axis does not pass through the center of the cam’s axis of rotation \(O\), and if the axis is eccentric in the \(x\)-axis direction from the axis of rotation by e, then in the above figure (Fig. 2), if \(v_c^{\prime}=v_c\cos\alpha=\omega\cdot\overline{OP} \cdot\cos\alpha\), \(v^{\prime}=v\cos\beta\), and \(v_c^{\prime}=v^{\prime}\), then,
$$ \omega\cdot\overline{Om}=v\cos\beta $$
If a perpendicular line is drawn from \(O\) to \(NN\) and its foot is \(m\), then \(\overline{OP}\cdot\cos\alpha=\overline{Om}\), then
$$ \omega\cdot\overline{Om}=v\cos\beta $$
Therefore,
$$ \frac{v}{\omega}=\frac{\overline{Om}}{\cos\beta}=\overline{On}$$.
This shows that the difference in eccentricity \(e\) has no effect.
pressure angle
The pressure angle \(\beta\) in Fig. 2 and Fig. 3 represents the angle between the axis of the follower of the cam mechanism and the standard tangent line at the contact point. The pressure angle is set to \(30^{\circ}\) because an excessively large pressure angle can hinder the rotation of the cam mechanism.
When obtaining a cam contour curve from the same cam diagram, the smaller the basic circle, the larger the pressure angle \(\beta\). To facilitate the transmission of rotation, it is preferable to increase the size of the basic circle.
The curve of Cam Shape
In this section, we will describe, with examples, the procedure of setting up a particular motion, considering the cam diagram, and obtaining the final contour curve. It is also assumed that the follower’s axis always passes through the center \(O\) of the basic circle.
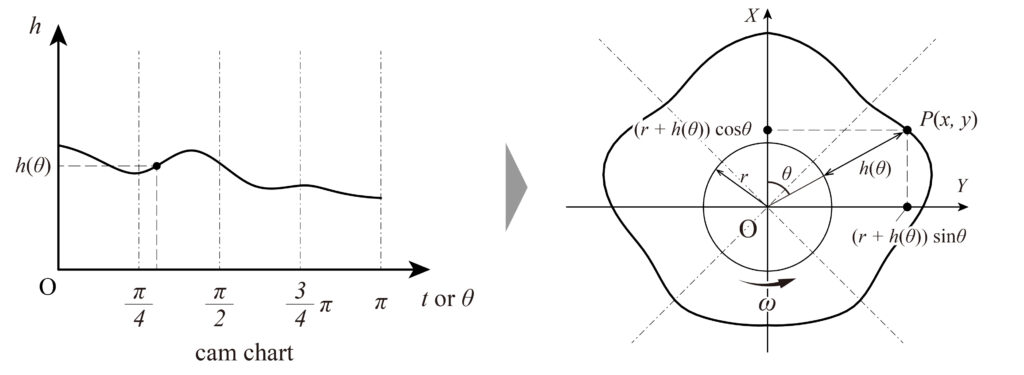
As shown in the figure above, when the cam rotates at a constant angular velocity \(\omega\), and the cam diagram is [0,\(\pi\)] relative to the basic circle, the cam diagram is divided to give a contour for the displacement relative to the angle corresponding to the basic circle. In other words, the contour curve of the cam is obtained by transforming the cam diagram from the Cartesian coordinate system to polar coordinates on the foundation circle of radius \(r\). The points \(P\)(\(x\),\(y\)) on the contour curve of the cam in terms of mediating variables can be expressed by the following equation.
$$ x = ( r + h(\theta))\sin\theta $$
$$ y = ( r + h(\theta))\cos\theta $$
Example of a follower’s movement
Cam diagram for constant velocity motion (\(v=\text{const.}\))

We assumed that one of the requirements for freely designing cams would be the desire to create a mechanism that does not have a constant velocity or acceleration. However, before that, we will describe the cam diagram for the most basic behavior at constant velocity, called constant velocity motion.
Let the displacement of the follower be \(h\) and the velocity be \(v\). Since the follower is in constant velocity motion, the following equation holds, and the cam diagram shows a straight line with slope \(\phi\) (Fig. 5 (a)).
$$ v=\frac{dh}{dt}=\tan\phi=\text{const.} $$
If the cam rotates at a constant angular velocity \(\omega\) and the axis line of the follower passes through the center of the cam’s axis of rotation \(O\), the contour curve of the cam is in polar coordinates \(r=r+a\theta\) with the origin at the center of the axis of rotation \(O\). Here, \(r\) represents the radius of the base circle, and \(\theta\) is the angle of the dynamic radius concerning the axis line at the start of the rotation. Also, \(\displaystyle a=\frac{dh}{d\theta}\), since the cam rotates at a constant angular velocity,
$$ a=\frac{dh}{d\theta}=\frac{v\cdot dt}{\omega\cdot dt}=\frac{v}{\omega}=\text{const.} $$
which is the same as that of the Archimedean curve. This curve is also called the Archimedean spiral. A cam with a contour curve that is inverted half-periodically and connected to this curve is called a heart cam (Fig. 5 (b)).
Cam diagram for iso-accelerating motion (\(a=\text{const.}\))
First, let’s look at a case in which we want to achieve iso-accelerative motion, i.e., behavior in which the acceleration is constant and the velocity changes step by step. If the initial velocity is 0, the displacement is \(h\), the acceleration is \(a\), and the time is \(t\), then \(\displaystyle h=\frac{a}{2}t^2\).
Here, since \(a\) is constant, if \(\displaystyle c=\frac{a}{2}\) is set as the constant \(c\), \(h=ct^2\) is expressed, and the cam diagram becomes a parabola. Here, if the angular velocity due to cam rotation is constant, it is possible to put time \(t\) as the rotation angle of the cam \(\theta\).
If the cam diagram is reversed at the maximum displacement (lift), the follower reaches its maximum speed in half a revolution because it is continuously connected, and the motion gradually decelerates after half a revolution. In this case, the cam’s contour curve is as shown in the figure below.
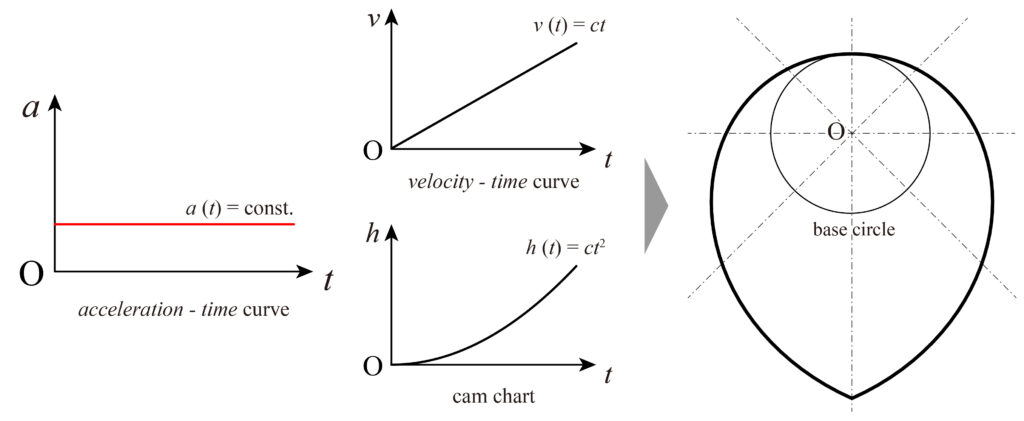
Cam diagram when set from acceleration
Suppose that acceleration is designed as a certain quadratic curve \(a(t)=ct^2\) like the acceleration diagram above. Since \(\displaystyle a(t)=\frac{dv}{dt}\), \(\displaystyle v(t)=\int a(t)dt\), \(\displaystyle v(t)=\frac{1}{3}ct^3+C\) (\(C\) is an integration constant), and \(v(0)=0\) \(\displaystyle v(t)=\frac{1}{3}ct^3\). Similarly, from \(\displaystyle v(t)=\frac{dh}{dt}\), \(\displaystyle h(t)=\int v(t)dt=\frac{1}{12}ct^4+C\) and \(h(0)=0\), \(\displaystyle h(t)=\frac{1}{12} ct^4\).
When set from acceleration, the final curve is quadratic because the order of the cam diagram is two more than that of the acceleration diagram.



コメント